Research
I use cosmological simulations to study the coevolution of massive black holes (BHs) and their host galaxies. My papers have investigated wandering BHs, active galactic nucleus (AGN) feedback, and the MBH–M★ relation. You can access them on my ADS/SciX library, or view some key figures below.
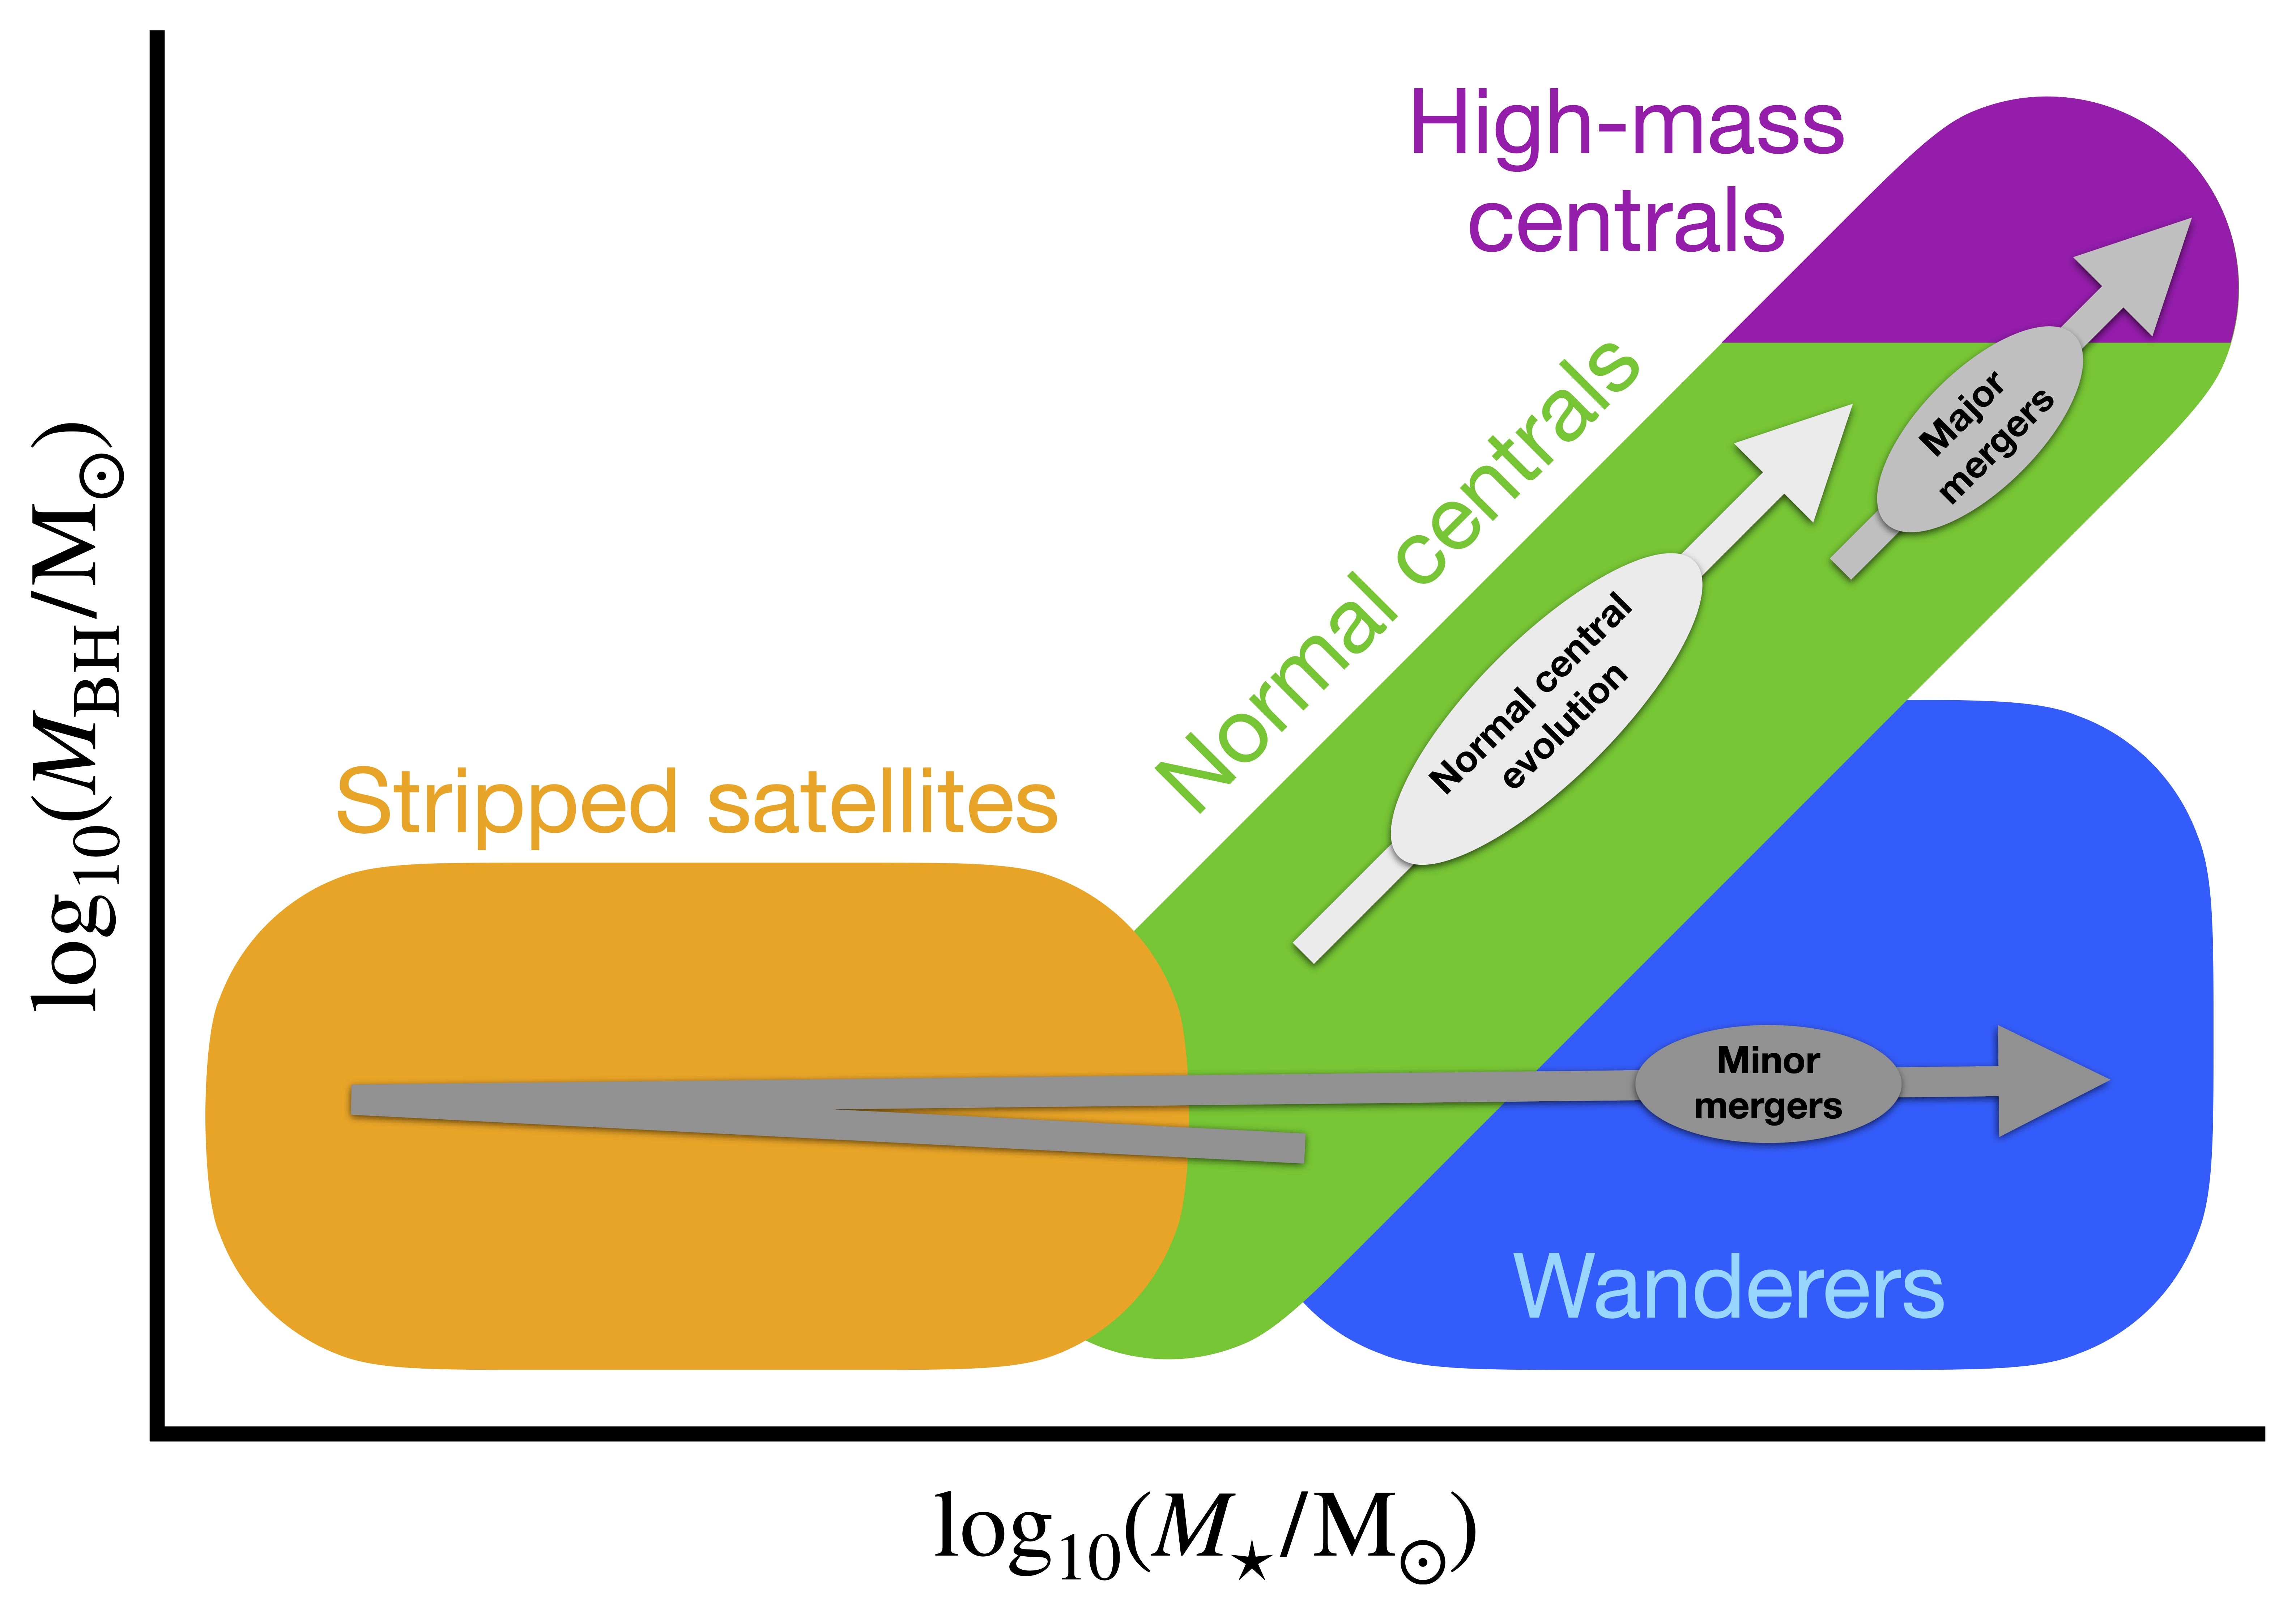
Schematic showing four regions of the MBH–M★ plane and the distinct evolutionary paths that build them. Normal centrals reside at the centers of their host galaxies, and grow upward along a linear MBH–M★ relation that is roughly consistent with local observational results by z~2. High-mass centrals lie at the upper end of the linear relation, and their growth is dominated by BH mergers that occur due to major galaxy mergers. AGN feedback suppresses BH accretion and star formation. Stripped satellites start on the low-mass end of the linear relation but are tidally stripped by nearby galaxies during minor galaxy mergers. They end up with overmassive BHs and minimal cold gas. Wanderers originate along the linear relation in satellites that later merge into more-massive galaxies. They form a clump of undermassive BHs with low merger and accretion rates. See Weller et al. 2026 (Figure 8).
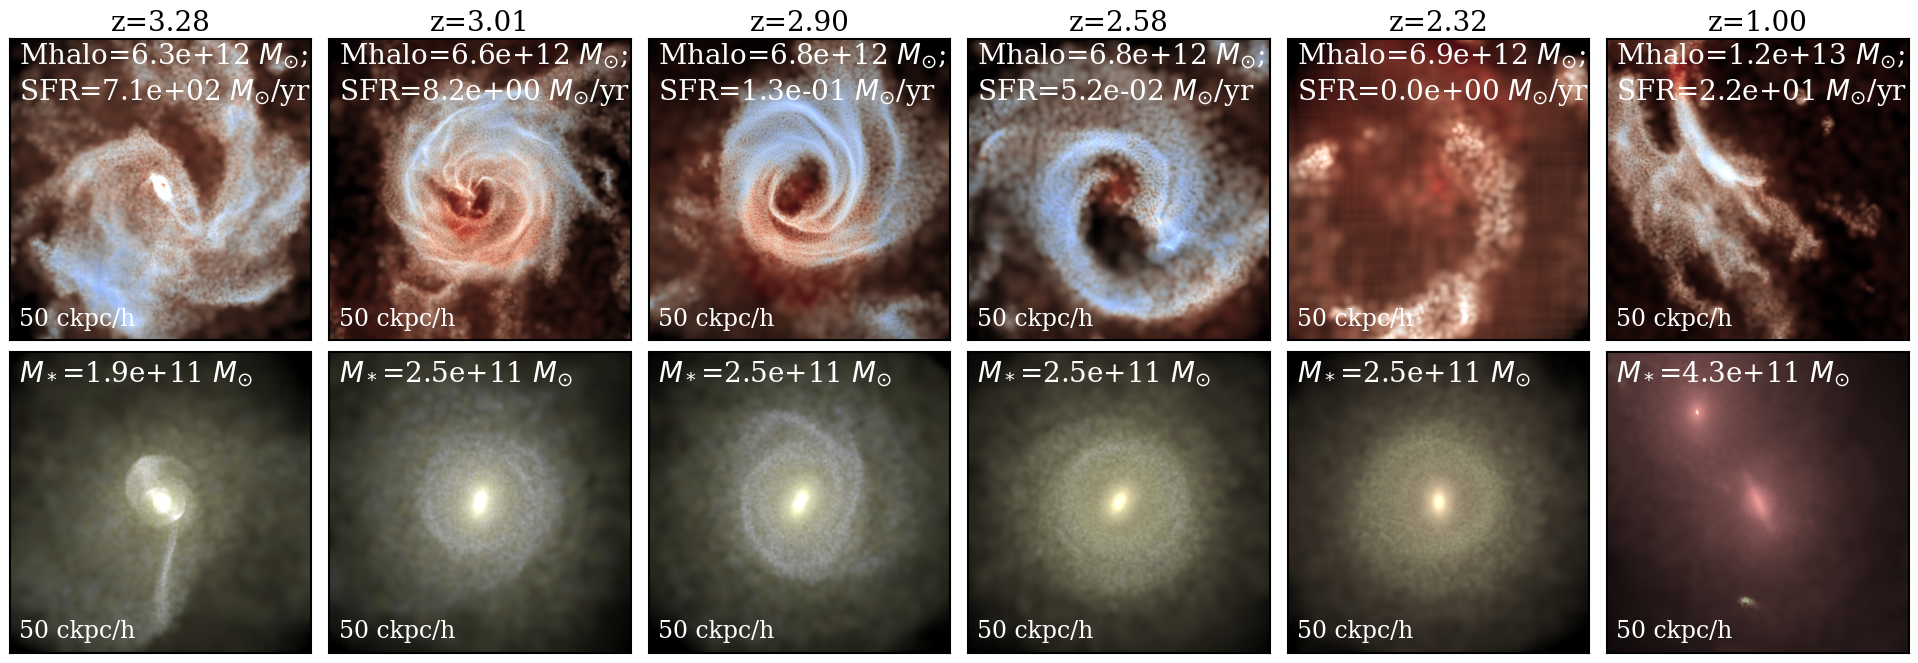
Maps of the gas density colored by temperature (top row, redder is hotter) and stellar density colored by age (bottom row, redder is older) for a galaxy in the TNG100 simulation. Brightness indicates the mass density. Each column shows the galaxy at a particular snapshot, and all boxes have a side length of 50 ckpc/h. At z~3 AGN kinetic feedback turns on, and gas is heated and expelled from the galaxy's center, quenching star formation. At z~1 new gas is brought into the galaxy via mergers with surrounding galaxies, reactivating star formation. See Weller et al. 2025 (Figure 9).
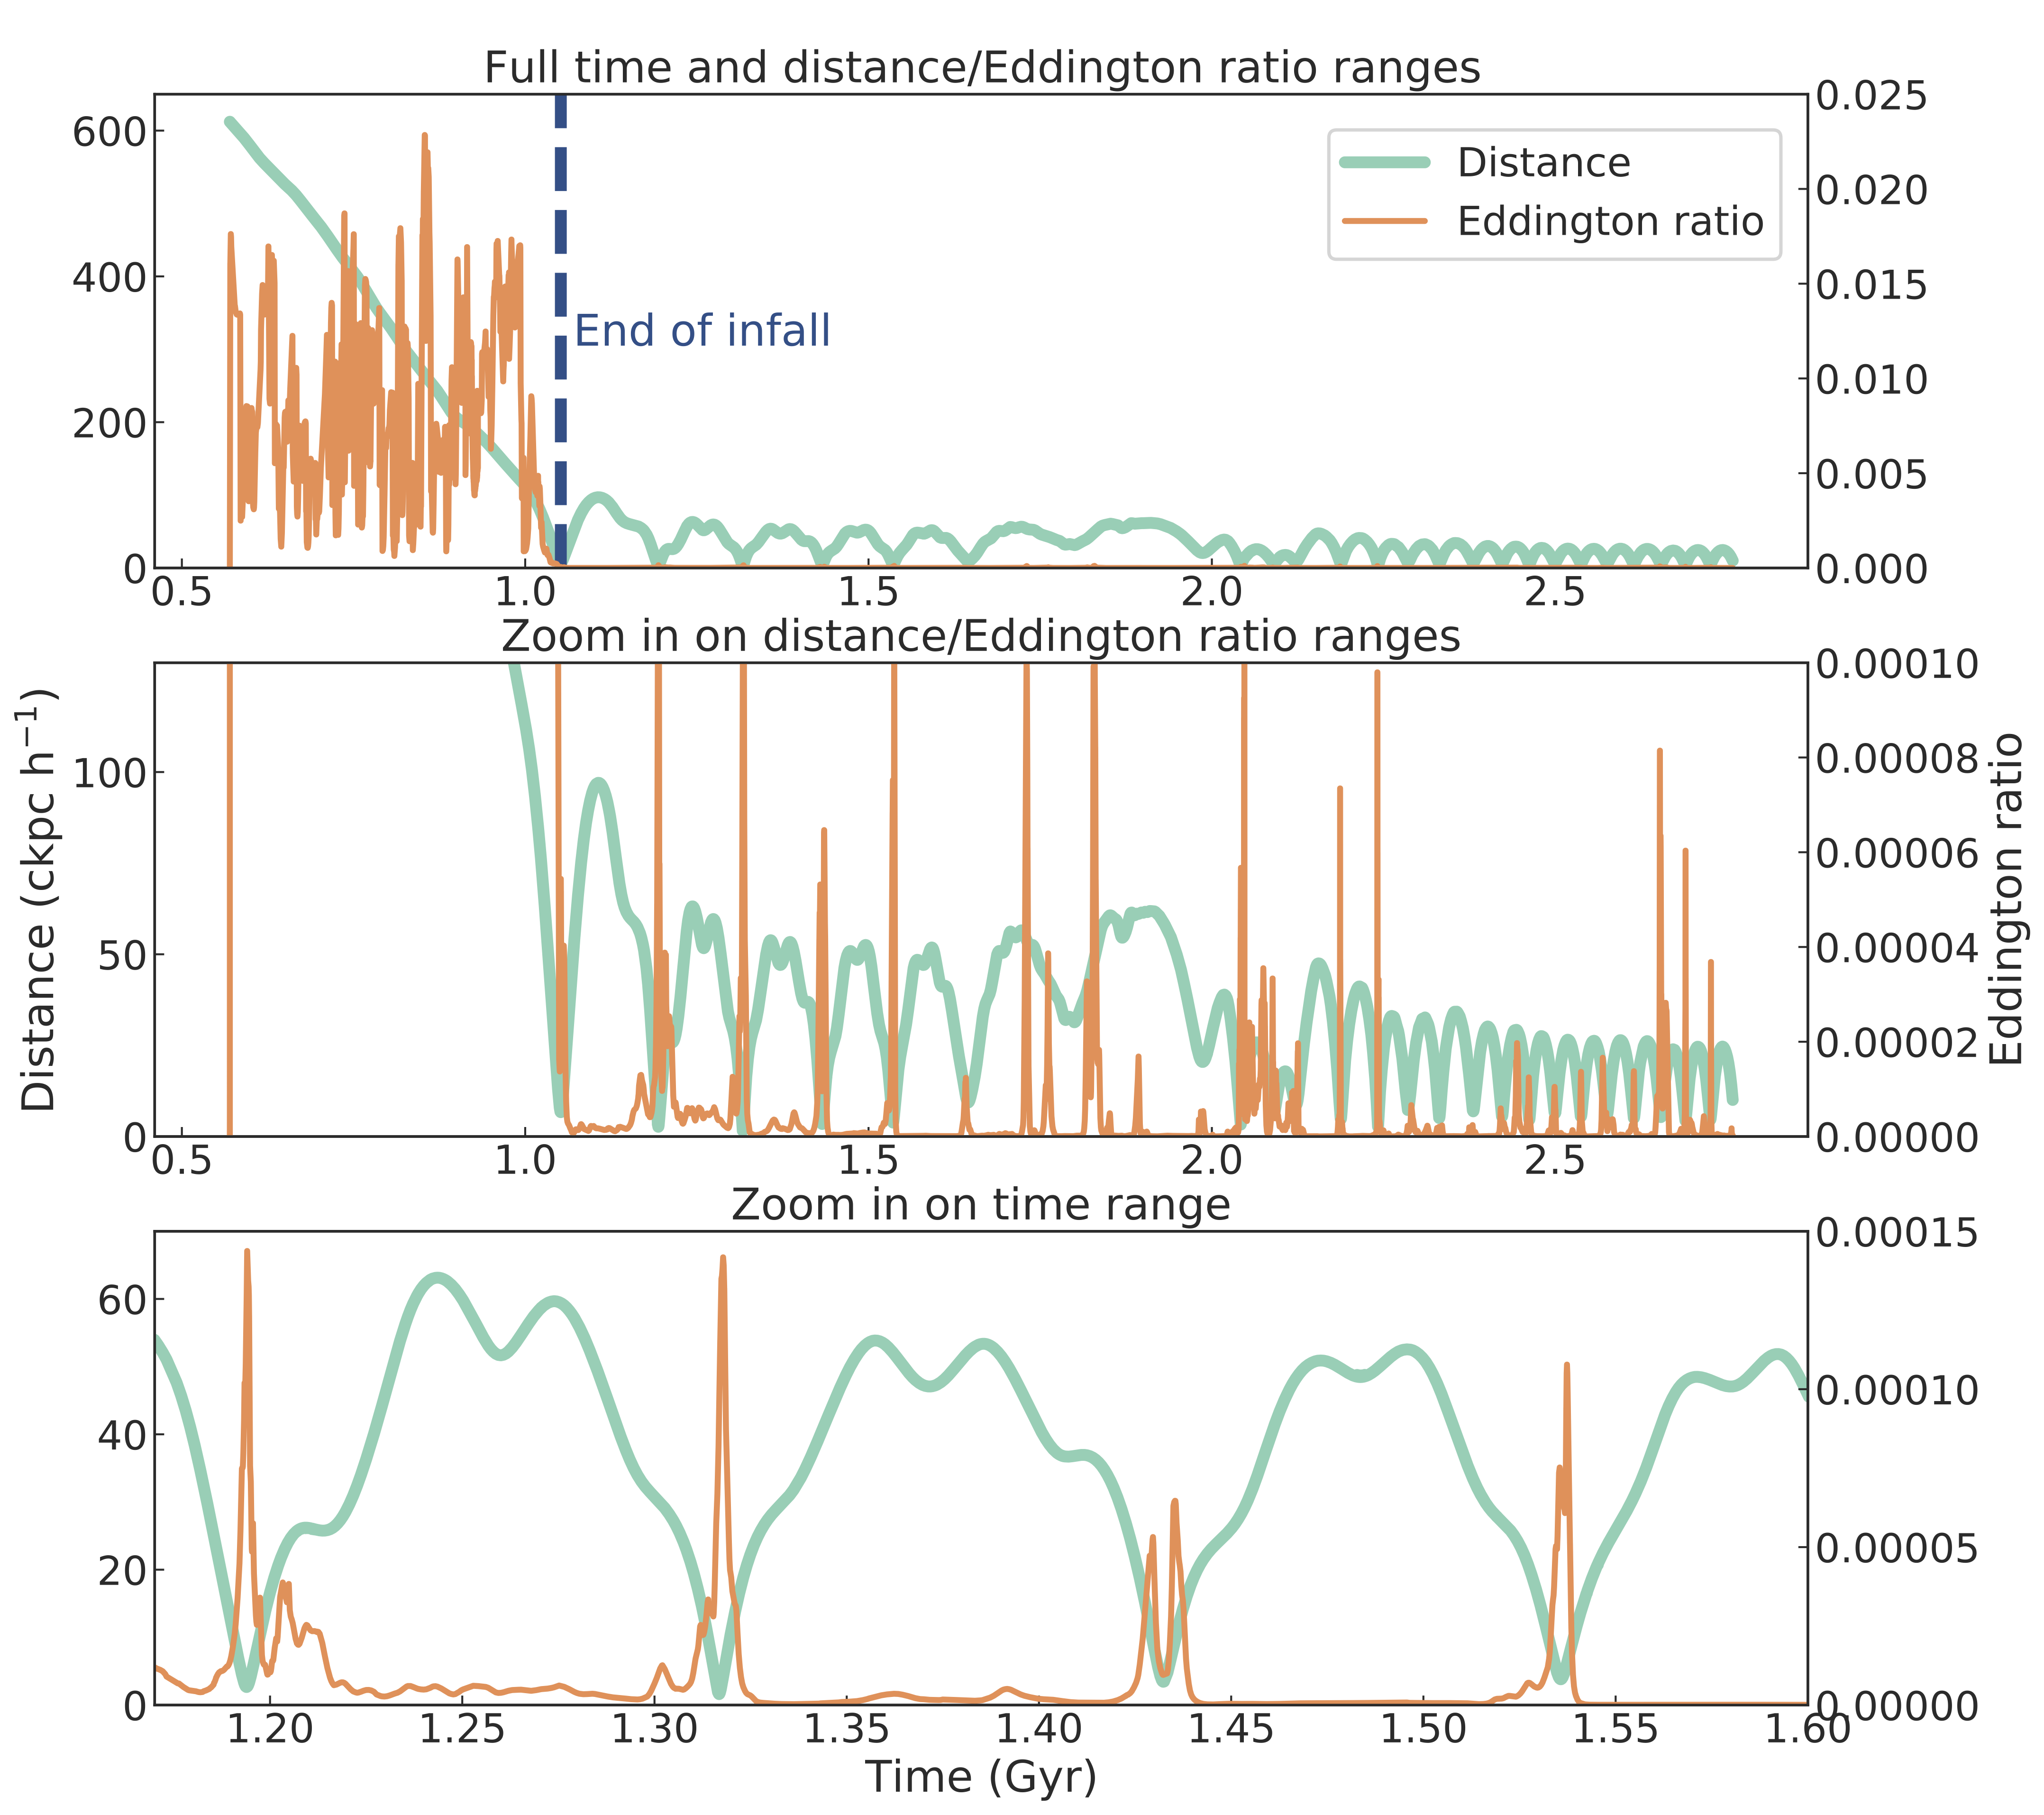
Galactocentric distance (thick green line) and Eddington ratio (thin orange line) vs. time for a wandering intermediate-mass BH in the ASTRID simulation. The Eddington ratio is high during the infall, and spikes when the distance is close to a minimum (which corresponds to the BH passing through a higher-density region). The middle and bottom panels zoom in for better visualization. See Weller et al. 2023 (Figure 5).